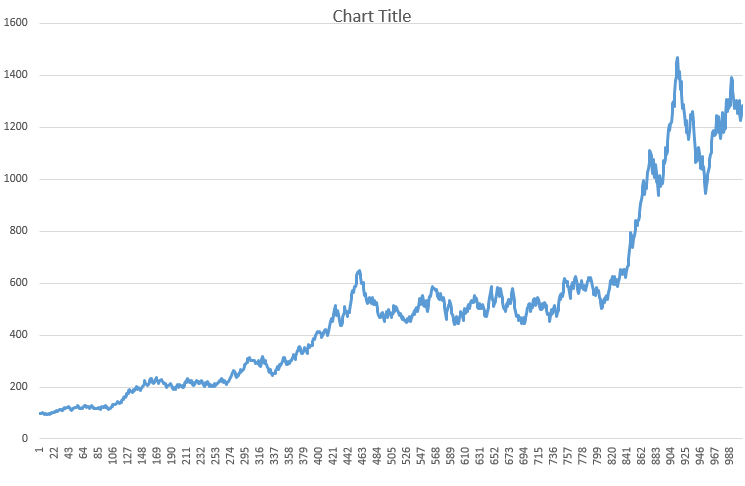
This is a price chart of what particular financial security / instrument?
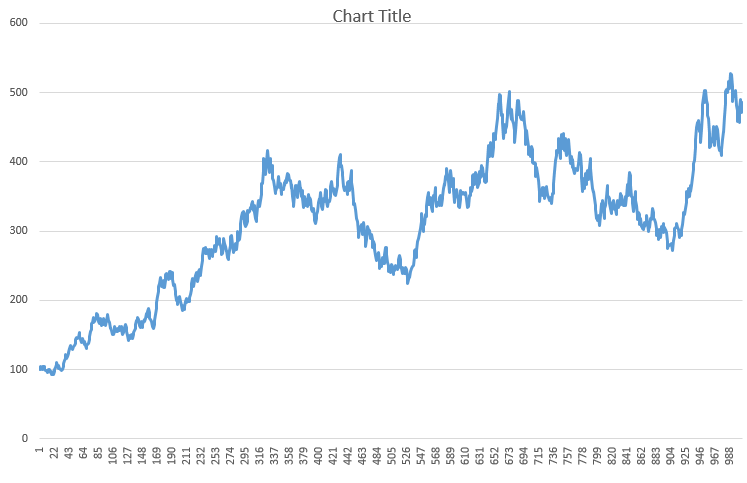
 It’s not. It’s a graph of a set of randomly generated values from within an Excel spreadsheet using the RAND() command with a simple adjusting factor to give it a slight upward bias.
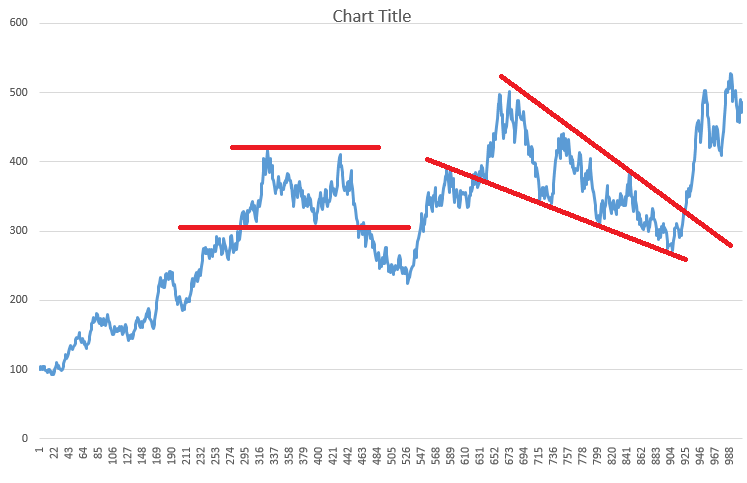
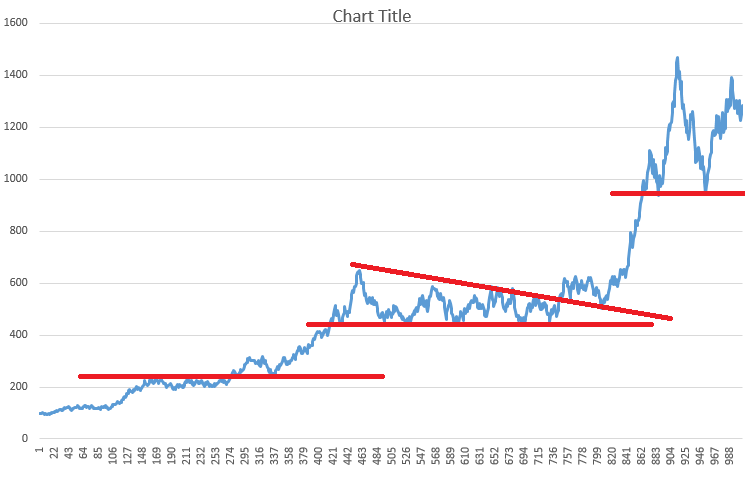
But yarrrrrgh! It doesn’t stop someone potentially drawing some nice pretty support and resistance lines to give a feeling that it somehow helps them gauge the price direction of a particular security or some index of a group of securities…
Yeah, Yea, Sure, sure, Technical Analysis is all about weight of probabilities. I think it’s pure luck that the price chart above showed support and resistance lines. Run the macro again, and it’s totally different…
Add Some more pretty lines. Double tops, Oooh, Descending Wedge pattern… Ya all Fooled by randomness I tells ya! I tells ya! I’m calling shenanigans!
—
You have a row of 20 coin Tossing Monkeys on a podium.
- Each flip a coin. 10 Monkey gets heads while the other 10 gets tails and are eliminated / removed from the podium
- Those who coin toss the Heads make it to the new round. Again they flip a coin. 5 monkeys get heads, the other 5 monkeys are eliminated
- 5 Monkeys toss a coin, 2 Monkeys get Heads, the other 3 monkeys are eliminated
- The remaining two monkeys toss a coin, one Monkey gets heads is crowned the supreme monkey, the other monkey goes home empty
We now have one supreme Monkey who goes on to write books about how he bet all other monkeys and managed to flip heads all the way through the competition. The Media are all over him wanting to know his secret. He then records audio tapes about his secret for success and goes on to conduct seminars on his secret of coin tossing.
Damn Charlatans… Be ware of them Binary Option Trading hawkers. Before that, it was Retail Forex trading. Seems a proliferation of these funny financial instruments recently.


Interesting stuff Ferg… can you share the code to generate this?
Hi Brodes, I will try and find the spreadsheet. (If not, will attempt to recreate it), I recall it was pretty basic thing which just used a series of Randomly generated values and subsequently a chart generated from that those series.